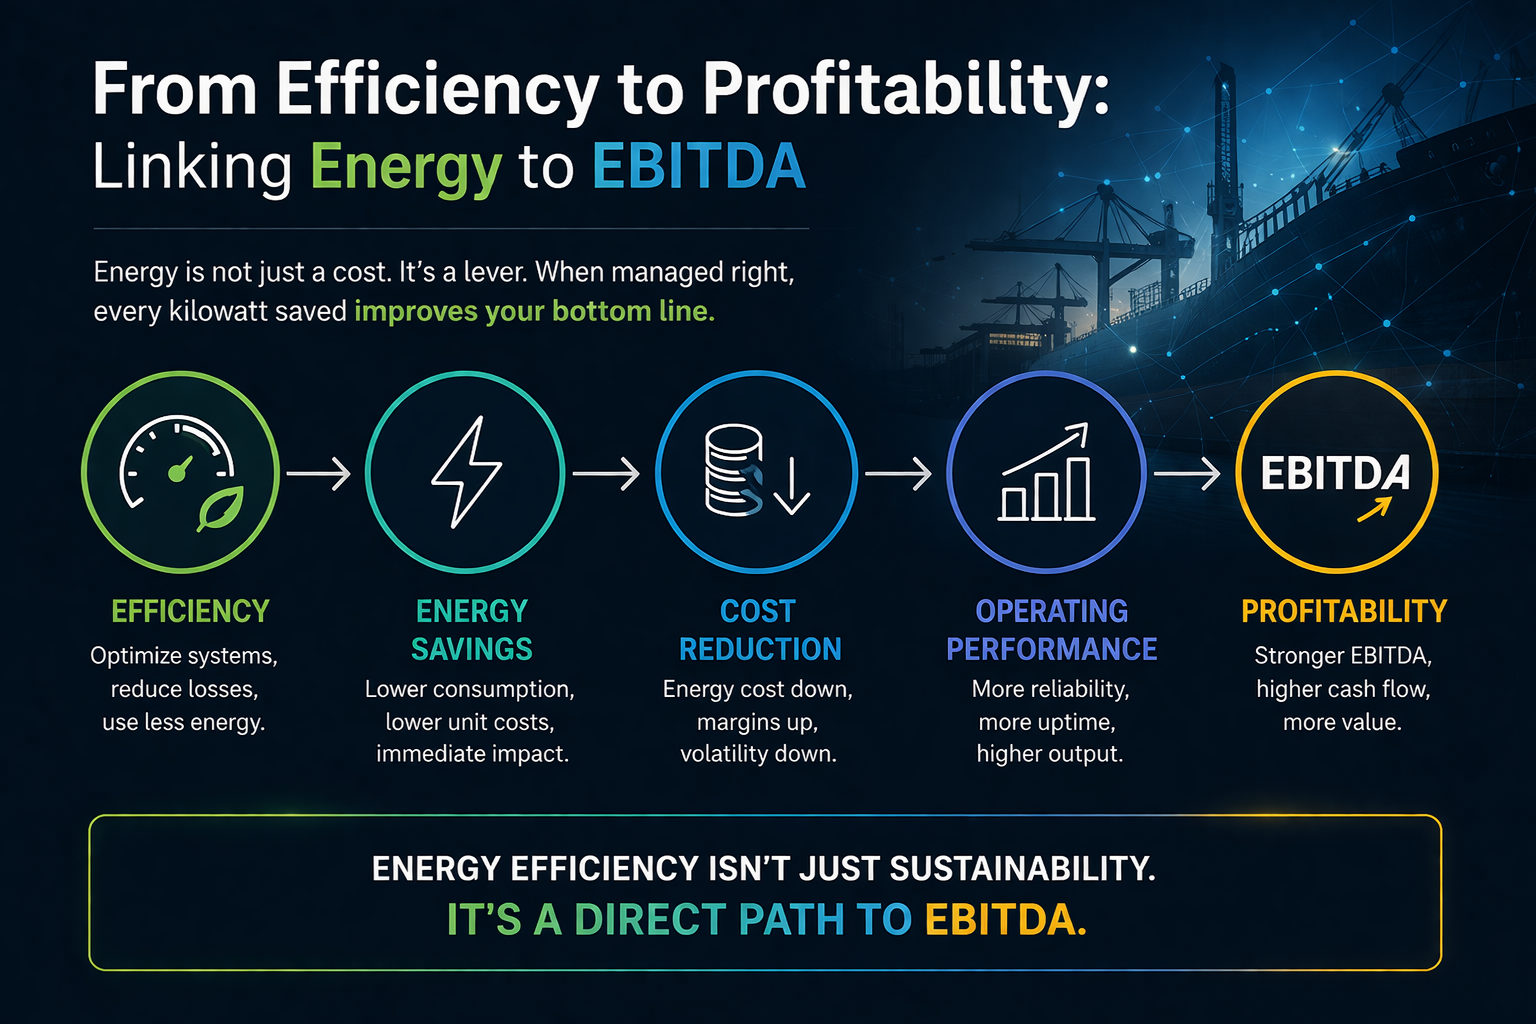
From Efficiency to Profitability: Linking Energy to EBITDA
EFFICIENCY BEFORE FUEL · SERIES POST 11 · WEEK 16, PART I · APRIL 2026
Why Every Percentage Point of Energy Savings Is Now a Direct EBITDA Lever —
Not Just Fuel Cost Reduction
Maritime Industry | Energy-to-EBITDA | Strategic Intelligence Brief | René Grywnow, DBA
The fuel cost reduction argument for efficiency investment is well-established. The EBITDA argument is not, and that gap is expensive. Companies that present efficiency upgrades as cost reduction capture one dimension of the value. Companies that present them as EBITDA drivers capture the full dimension: better charter rates, lower EU ETS liability, superior asset valuations, and financing at 40–60 basis points below standard terms. The difference between those two framings is the difference between a cost centre and a strategic advantage.
EXECUTIVE SUMMARY
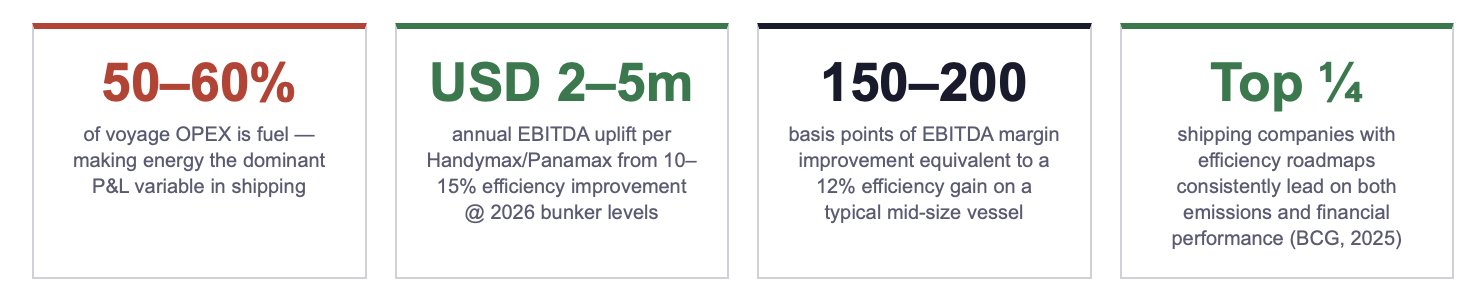
Fuel accounts for 50–60% of voyage OPEX. A proven 10–15% efficiency improvement via combined drydock packages translates directly into USD 2–5 million annual EBITDA uplift per mid-size Handymax/Panamax vessel at 2026 bunker levels, equivalent to a 150–200 basis-point margin improvement.
BCG (2025) analysis confirms: shipping companies in the top performance quartile, those with documented decarbonisation roadmaps and fleet efficiency programmes, consistently outperform on both emissions and financial metrics. Efficiency and profitability are not in tension. They are the same variable, measured at different points in the P&L.
Lloyd's List Shipping Podcast (April 2026, Sean Riley, Veson Nautical) documents the inflection: emissions data collected for EU ETS, FuelEU, and IMO DCS is now used for real-time commercial budgeting, fixture pricing, and asset allocation. The compliance stack has become the commercial intelligence layer.
1. The EBITDA Multiplier Effect of Energy Efficiency
The accounting logic is straightforward: every dollar saved on fuel drops directly to EBITDA. Unlike revenue improvements, which must first recover variable costs, port fees, canal dues, and crew expenses before contributing to the bottom line, fuel savings have no intermediate deduction. They are structural, permanent, and immediately visible in the P&L from the first voyage after a retrofit.
What makes this logic more powerful in 2026 than in previous years is the compounding of three simultaneous value streams from a single efficiency investment. The first is the direct fuel cost saving, the calculation most operators already make. The second is the EU ETS cost avoidance on the saved consumption volume, which adds a regulatory premium to every tonne of fuel eliminated. The third is the charter rate differential: vessels with CII A or B ratings are fixing at rate premiums of 1–4% in progressive charter programmes, while CII C/D/E vessels increasingly face rate discounts or fixture exclusion.
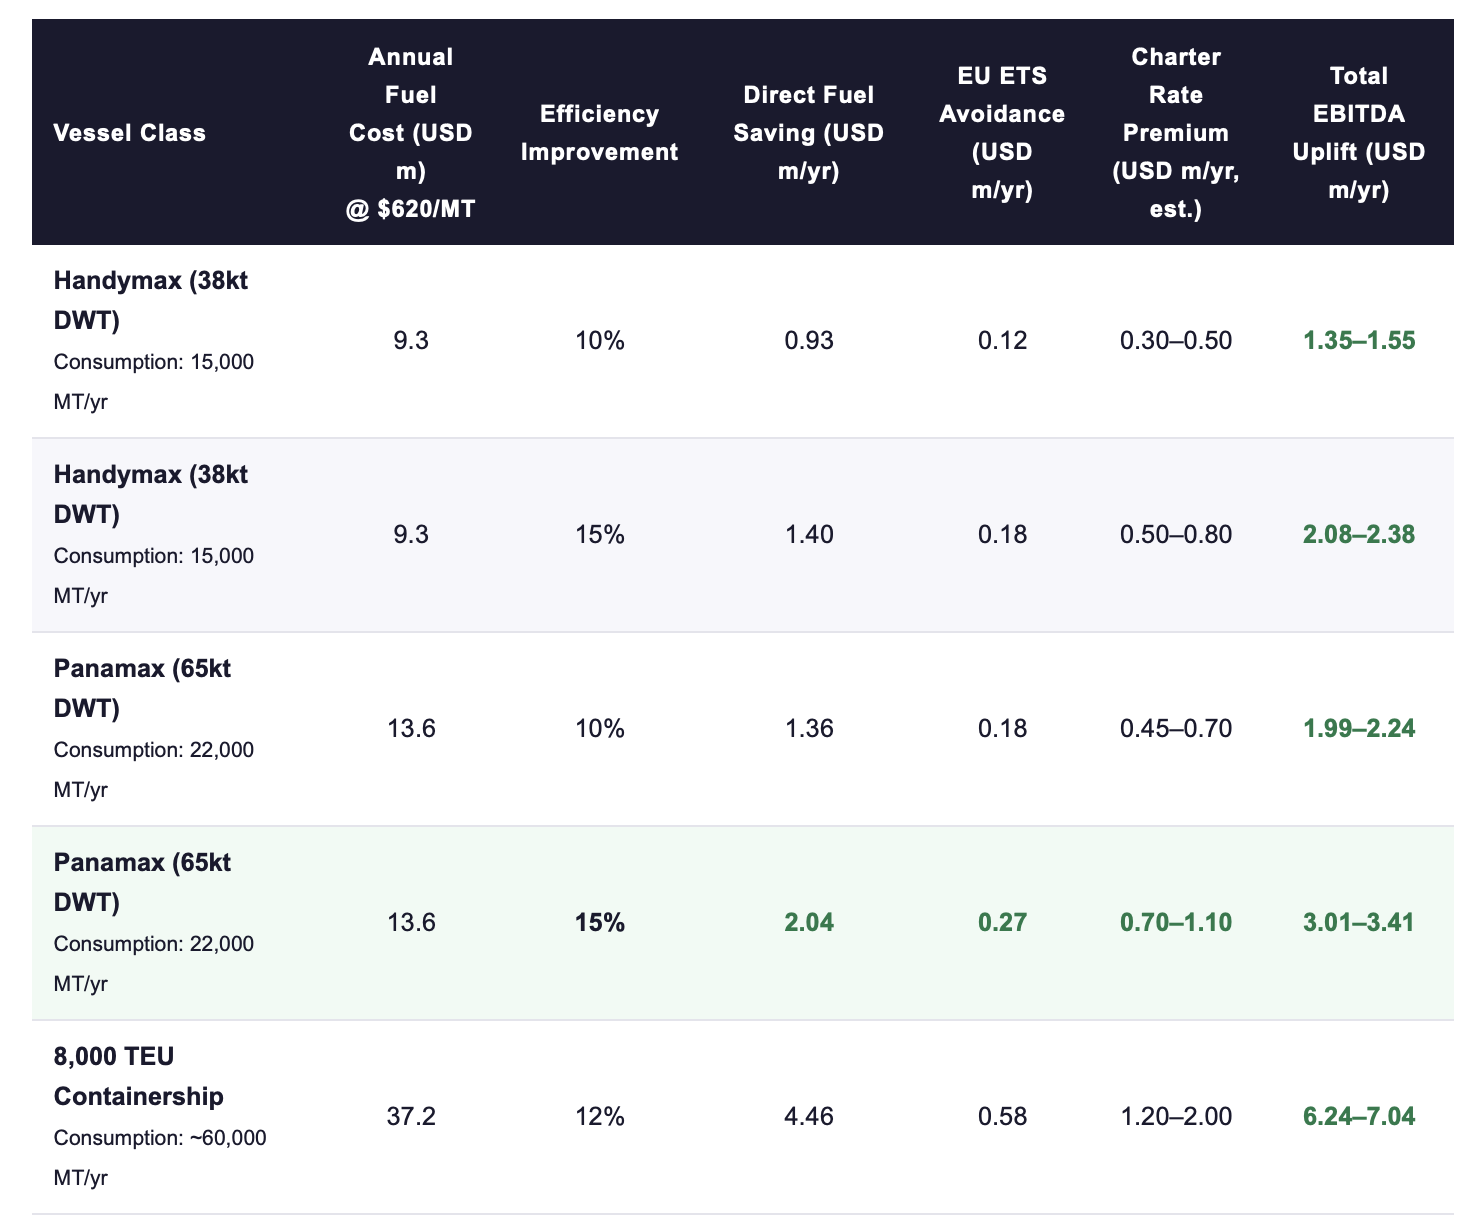
Fuel saving: efficiency % × annual fuel cost. EU ETS avoidance calculated at €50/tonne CO₂ (EU ETS marine reference, 2026), 3.206 tonne CO₂/tonne VLSFO, 50% phase-in. Charter premium: 1–3% applied to estimated time-charter equivalent revenue for CII A/B vs. C rating. Sources: PwC, 2026; Poseidon Principles, 2024; BCG, 2025; own modelling.
BCG's 2025 analysis of leading shipping companies provides the empirical grounding for the charter premium column. The study found that companies with documented fleet efficiency programmes and CII improvement roadmaps consistently achieved higher time-charter equivalent rates, lower financing costs, and superior return on capital employed versus peers without such programmes, across the 2022–2025 period, which spanned both the post-COVID rate cycle and the subsequent normalisation. The efficiency advantage was most pronounced in volatile rate environments, precisely because efficient operators could hold charter positions that less efficient competitors could not economically justify.
The BCG finding is structurally significant: the EBITDA advantage of efficiency is not purely mechanical (fuel cost out = profit in). It is also commercial, and the commercial premium compounds over time as charterer screening becomes more rigorous and lender alignment reporting becomes more onerous for non-compliant assets.
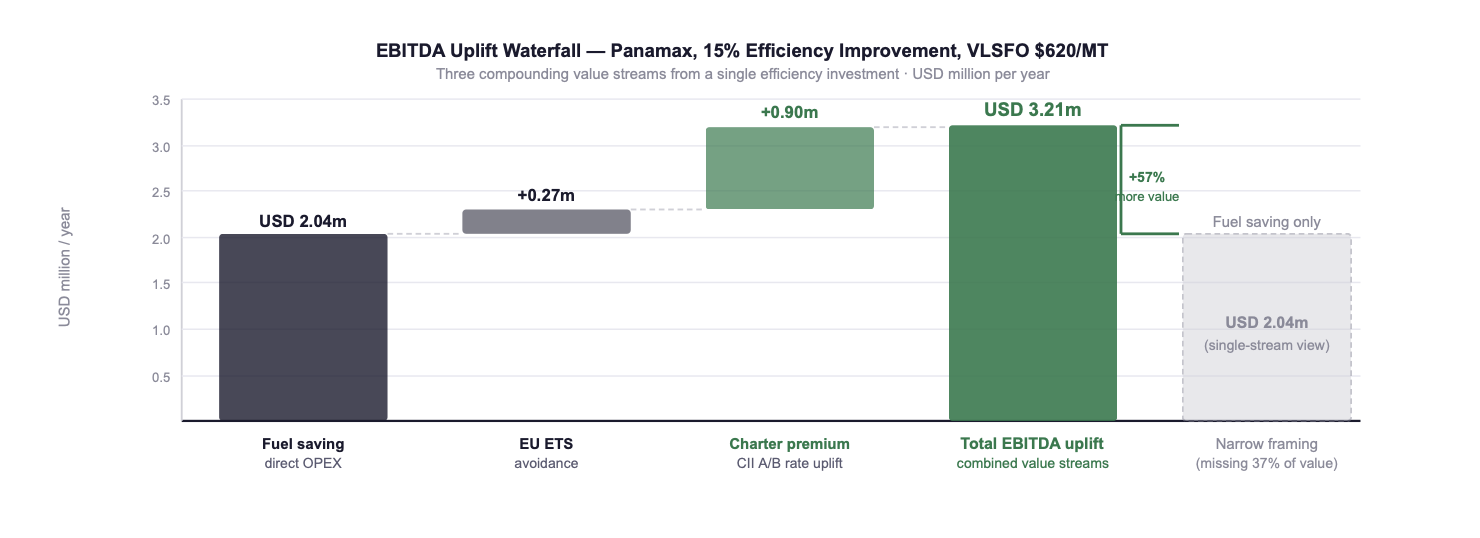
Fig. 1: EBITDA uplift waterfall for a Panamax vessel, 15% efficiency improvement, VLSFO $620/MT. The full three-stream view (USD 3.21m) exceeds the fuel-saving-only view (USD 2.04m) by 57%. Charter premium midpoint used; EU ETS at €50/tonne CO₂, 50% phase-in. Sources: PwC, 2026; BCG, 2025; own modelling.
👉 Key Insight: Energy efficiency is the highest-ROI lever in maritime because savings are immediate, measurable, and independent of fuel-price bets or infrastructure commitments. But the full value is only captured when all three streams, direct fuel saving, EU ETS avoidance, and charter rate premium, are modelled together. Operators who frame efficiency as a cost item capture USD 2.04m. Operators who frame it as an EBITDA driver capture USD 3.21m. The framing is not academic: it determines approval thresholds, discount rates, and investment sequencing.
2. From Compliance Data to Commercial Intelligence
The Lloyd's List Shipping Podcast episode from March 2026, featuring 90POE, captures a development that deserves explicit strategic attention: the compliance data infrastructure built for EU ETS, FuelEU Maritime, and IMO DCS is no longer functioning purely as a regulatory reporting mechanism. It has become commercial intelligence, real-time input into freight budgeting, fixture pricing, route optimisation, and asset allocation decisions.
📻 LLOYD'S LIST PODCAST: MARCH 2026 (90POE)
The episode documents how emissions monitoring data collected for regulatory compliance purposes is being repurposed for commercial decision-making in real time: freight budget modelling, CII-based fixture pricing, and competitive vessel positioning. The compliance stack has become the commercial intelligence layer, and operators who have invested in data quality are discovering a competitive advantage that their peers without that infrastructure cannot access.
Source: Lloyd's List Shipping Podcast, "Emissions compliance data can deliver efficiency and competitive advantage," March 2026.
📻 LLOYD'S LIST PODCAST: APRIL 2026 (SEAN RILEY, VESON NAUTICAL)
Sean Riley of Veson Nautical confirms the structural shift: decarbonisation is no longer primarily a technical or regulatory topic in commercial shipping. It has moved into voyage management, fixture negotiation, and financial planning as a first-order decision input. Companies that treat emissions data as a compliance obligation produce reports. Companies that treat it as a commercial asset make better decisions.
Source: Lloyd's List Shipping Podcast, "Decarbonisation is a significant factor in commercial decision-making," April 2026.
The commercial consequence of this shift is already visible in charter markets. Vessels with CII A or B ratings and verified fuel consumption data are not merely receiving compliance clearance from charterers, they are being actively preferred in fixture negotiations, with rate premiums that are now documented across multiple trade lanes. The following table quantifies the CII premium differential based on available 2025/2026 fixture market data and PwC (2026) commercial analysis.
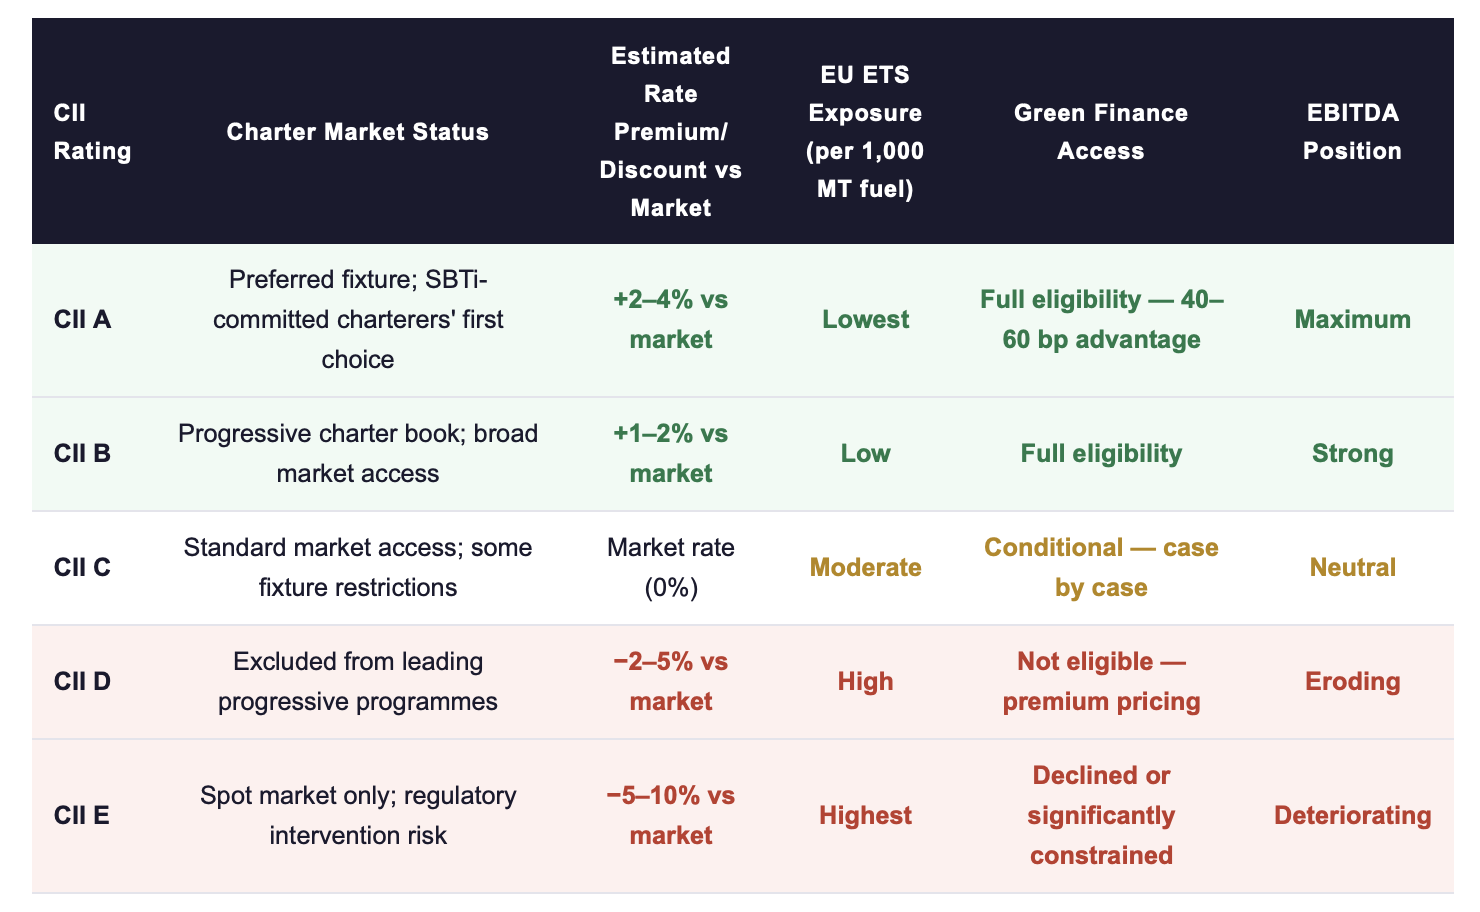
Rate premium/discount estimates based on PwC Sustainable Shipping Economics, 2026; Poseidon Principles annual report, 2024; Sea Cargo Charter transparency data, 2025. CII methodology per IMO MARPOL Annex VI revision 2023. EU ETS at €50/tonne CO₂, 2026 phase-in rate.
The rate differential between a CII A vessel and a CII D vessel is not 2–9% of charter rates in isolation, it is 2–9% on the revenue line, falling directly to EBITDA with no intermediate cost recovery. On a Panamax earning approximately USD 12–15 million per year in time-charter equivalent revenue, the difference between CII A and CII D positioning represents USD 0.5–1.4 million in annual EBITDA, simply from the commercial positioning of the asset, before any fuel cost calculation.
👉 Key Insight: The compliance data collected for EU ETS and IMO DCS reporting is not a regulatory cost centre, it is a commercial intelligence asset that directly determines charter rates, financing terms, and asset valuations. Companies that have invested in data quality and efficiency infrastructure are not just compliant. They are commercially advantaged in ways that their peers without that infrastructure cannot replicate from a standing start.
3. Three Scenarios: Quantifying the EBITDA Spread
The following scenario comparison makes the EBITDA differential between efficiency positions concrete. All three scenarios are evaluated for a Panamax 65,000 DWT vessel at 2026 operating assumptions: VLSFO USD 620/MT, EU ETS €50/tonne CO₂ at 50% phase-in, and Time-Charter Equivalent revenue of USD 13 million per year.

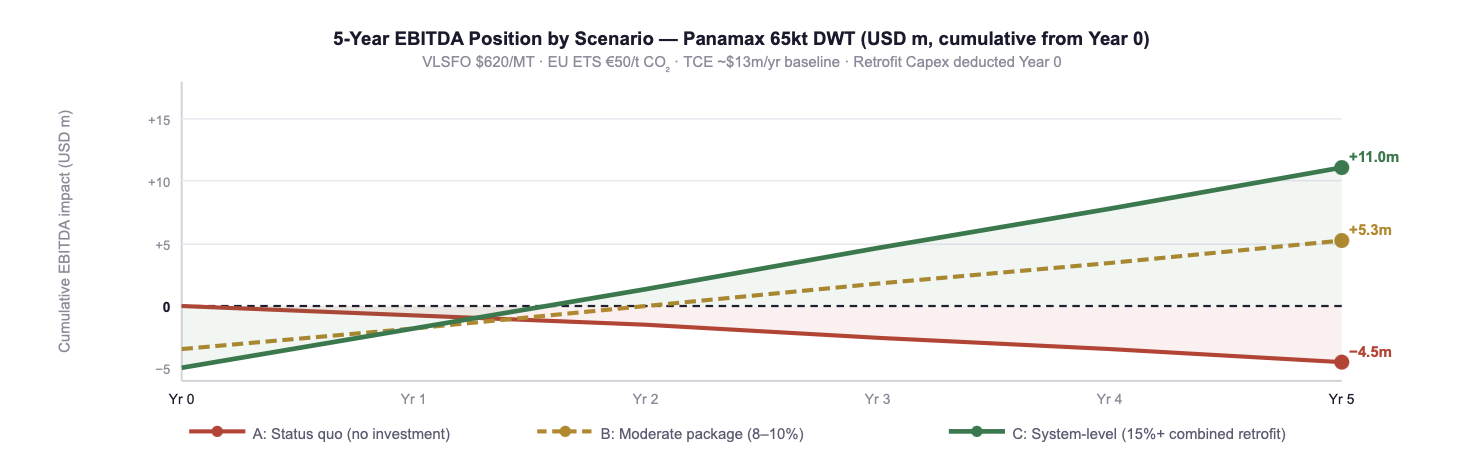
Fig. 2: Cumulative 5-year EBITDA position by scenario (Panamax, Year 0 = retrofit decision date). Scenario A (no investment) produces cumulative negative EBITDA impact of −USD 4.5m through escalating EU ETS costs and charter rate erosion. Scenario C (system-level) reaches cumulative +USD 11m by Year 5 despite higher Capex at Year 0. Capex deducted at Year 0: Scenario B USD 3.5m, Scenario C USD 5m. Sources: PwC, 2026; BCG, 2025; own modelling.
👉 Key Insight: The three-scenario comparison makes one point with precision: inaction is not neutral. The status quo does not preserve the current EBITDA position, it actively erodes it, through escalating EU ETS costs, charter rate discounts, and rising financing premiums. By Year 5, the EBITDA spread between Scenario A and Scenario C is USD 15.5 million on a single mid-size vessel. That is not a rounding error. It is the compounding cost of treating efficiency as optional.
4. CEO Action Plan: Making Energy a Board-Level EBITDA Topic
The operational translation of the EBITDA case into board-level governance requires four structural changes. These are not aspirational, each has a direct mechanism, a measurable output, and a responsible function that can be assigned today.
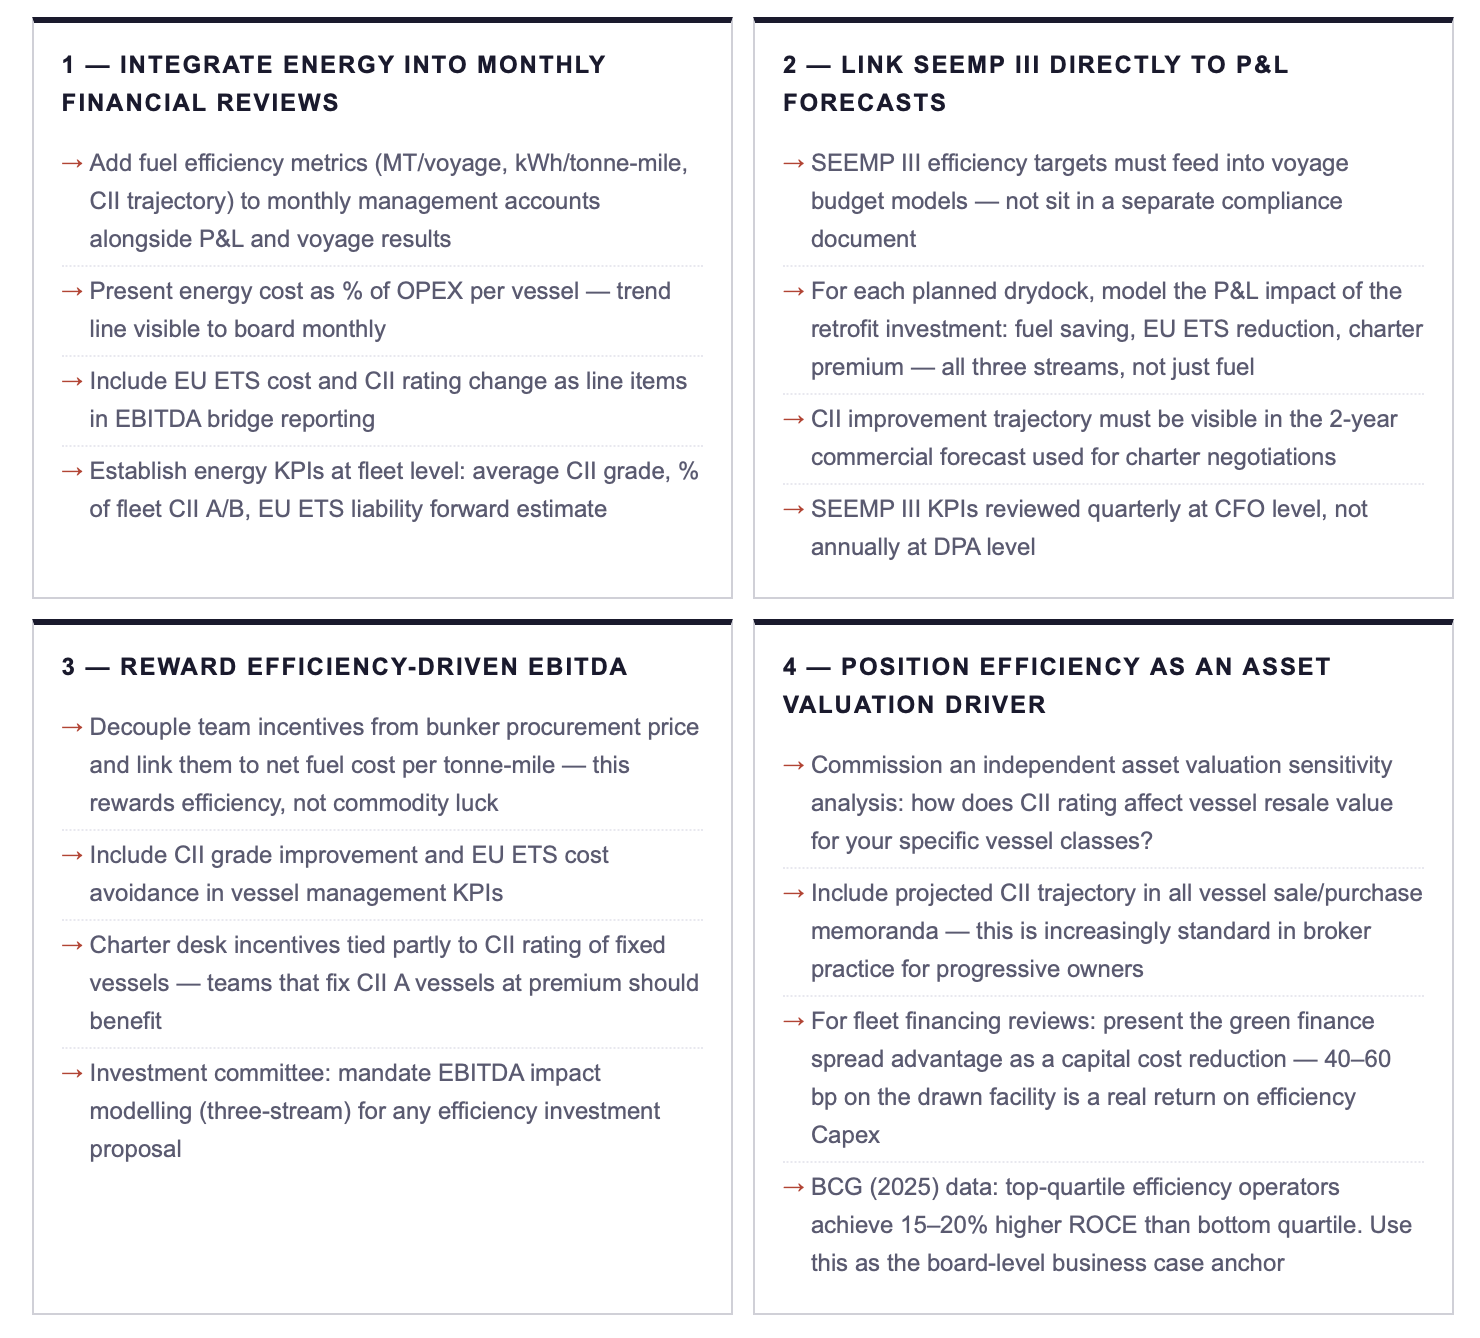
The BCG (2025) finding on ROCE differential deserves particular emphasis. A 15–20% higher return on capital employed, consistently, across cycles, is not a marginal advantage. It is the kind of structural outperformance that separates businesses that compound value from those that merely participate in market cycles. The mechanism is not complex: lower fuel cost per unit of output, lower compliance liability, better access to capital, and higher charter rates combine to produce a structurally superior margin profile that persists independently of freight rate cycles.
👉 Key Insight: The CEO action plan above is not a transformation programme. It is a governance upgrade, four changes to how existing data is used, how existing teams are incentivised, and how existing investment decisions are modelled. None of the four requires new technology, new personnel, or new capital beyond the efficiency investment itself. What it requires is the decision to treat energy as a strategic EBITDA variable rather than a procurement commodity. That decision costs nothing to make. Every day it is deferred costs exactly what the efficiency table above documents.
5. The Asset Valuation Dimension: Efficiency as Long-Term Capital
The EBITDA case documented in this post understates the full financial value of efficiency investment by omitting the asset valuation dimension. Vessels with documented CII A/B ratings and verified efficiency performance profiles are increasingly commanding premium valuations at resale, and, conversely, vessels with persistent CII D/E ratings face discounts that exceed the cost of the retrofit investment that would have prevented them.
The mechanism is straightforward. A vessel's resale value reflects its remaining earning power. If a vessel enters the resale market with a CII D rating, a prospective buyer must either plan a retrofit (known cost, known timeline) or accept restricted charter access (known EBITDA penalty). The buyer prices both risks into the bid. The seller absorbs the discount. The discount is, in almost every documented case, larger than the retrofit Capex that would have prevented the CII deterioration.
PwC (2026) documents a parallel dynamic in the green finance market: vessels that qualify for Poseidon Principles lending at green terms have demonstrably lower weighted average cost of capital than non-qualifying peers. Across a fleet of ten vessels with a combined borrowing of USD 150 million, a 50 bp financing spread differential translates to USD 750,000 per year in reduced interest cost, permanently, for the life of the facility. That is a capital return on the efficiency investment that appears nowhere in the fuel cost savings calculation and nowhere in the charter premium estimate. It is the third layer of financial value that most operators have not yet integrated into their investment framework.
👉 Key Insight: The complete financial case for efficiency investment comprises four value streams: direct fuel saving, EU ETS avoidance, charter rate premium, and reduced financing cost. Most operators model one. Progressive operators model two or three. The operators achieving top-quartile ROCE model all four, and the gap between the one-stream view and the four-stream view is where strategic advantage is built or surrendered.
ACTION RECOMMENDATIONS
IMMEDIATE MEASURES (0–90 DAYS)
Build the three-stream EBITDA model for your top five vessels: fuel saving + EU ETS avoidance + charter premium at current CII rating and at the CII rating achievable via your next drydock package, present both to the board.
Add energy efficiency KPIs to the next monthly management accounts: fuel cost as % OPEX per vessel, CII rating, EU ETS liability (actual and projected). Make the data visible before asking for investment decisions.
Request the BCG (2025) ROCE differential data as a board presentation anchor, use the top-quartile vs. bottom-quartile comparison to frame the strategic stakes of the efficiency investment decision.
Commission an independent assessment of CII rating impact on vessel resale value for your specific vessel classes, this becomes the asset valuation dimension of the investment case.
STRATEGIC COMMITMENTS (6–24 MONTHS)
Formally link SEEMP III targets to P&L forecasts in the annual budgeting cycle, efficiency targets must live in the commercial model, not in the compliance documentation silo.
Restructure team incentives: decouple from bunker procurement price, link to net fuel cost per tonne-mile and CII grade improvement, reward the behaviour that creates EBITDA, not the behaviour that manages commodity exposure.
Integrate the four-stream EBITDA model (fuel + ETS + charter + financing) as the mandatory analytical framework for any efficiency investment proposal above USD 250,000, investment committees that approve on Capex alone are systematically underfunding the fleet.
Develop fleet-level efficiency positioning: classify every vessel by current CII rating, projected 2027 trajectory, and EBITDA impact of each rating grade, use this as the prioritisation matrix for the retrofit programme.
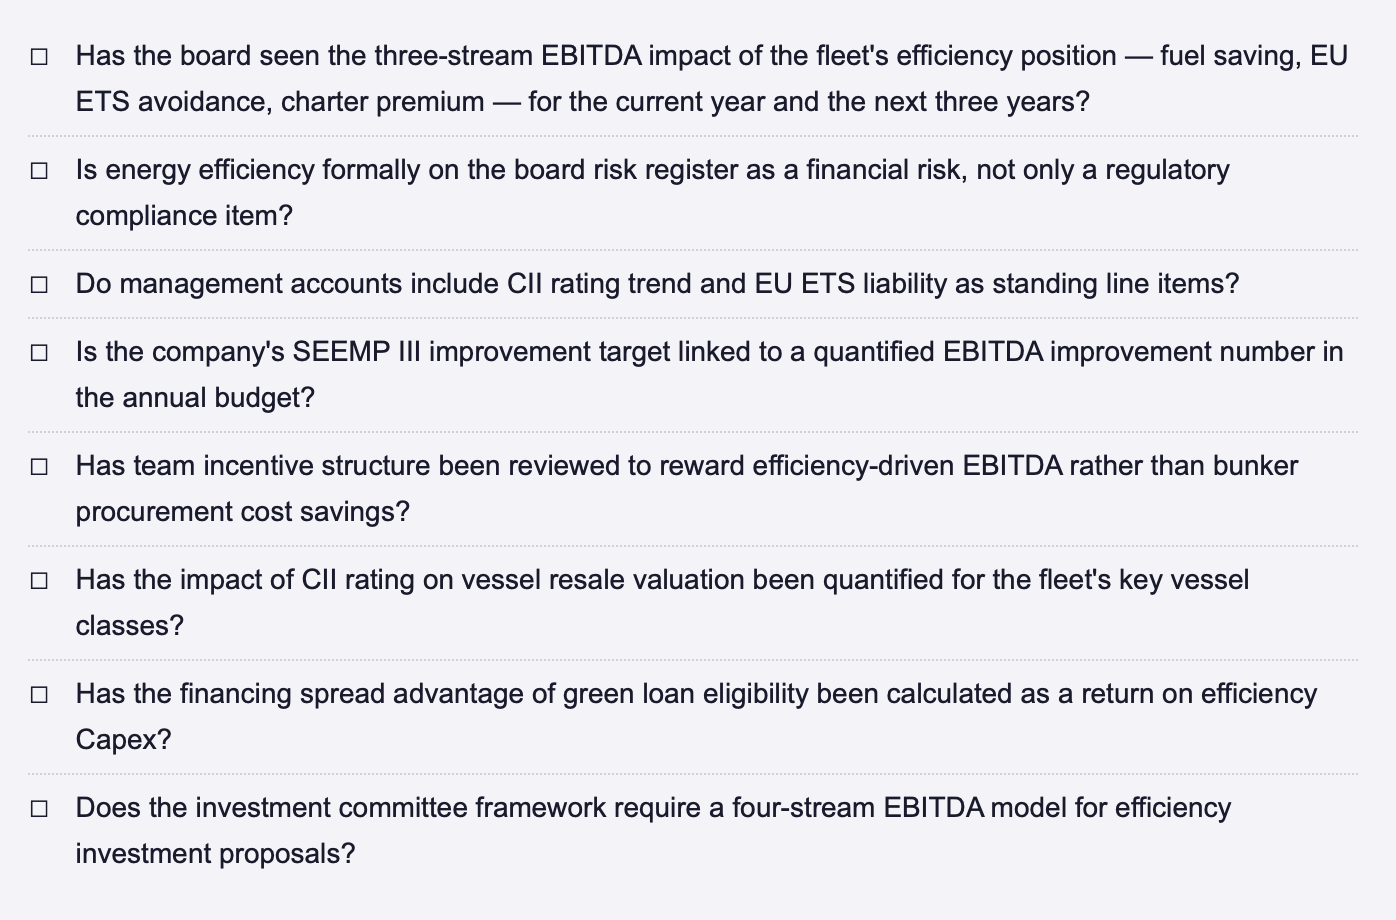
ENERGY-TO-EBITDA BOARD CHECKLIST — STRATEGIC QUESTIONS FOR THE NEXT BOARD MEETING
FINAL THOUGHT
The efficiency investment case has been made in this series in terms of payback, NPV, and scenario resilience. This post makes it in the language that boards actually use: EBITDA, ROCE, and asset valuation. The numbers are different, larger, because the full value of efficiency investment extends well beyond the fuel cost line. A Panamax operator who achieves system-level efficiency dominance and manages all four value streams is not running a more efficient vessel. They are running a structurally more profitable business, one with lower costs, better revenue access, cheaper capital, and higher asset values than a peer operating the same vessel without the same efficiency programme. That structural advantage does not fluctuate with freight rates. It compounds with time. And it begins with a single investment committee decision framed in the right terms.
How does your organisation currently connect energy performance to EBITDA reporting, and what would change in your investment committee conversations if the four-stream model were the required analytical standard? Connect for a direct exchange or share your current framework. | Next in this series: The Decarbonisation Roadmap for 2026–2030, translating the efficiency-to-EBITDA framework into a sequenced fleet programme with regulatory milestones.
REFERENCES
BCG (Boston Consulting Group) (2025) The Energy-Efficient Route to Maritime Decarbonization: Fleet Performance, Financial Outperformance, and ROCE Differentials. Boston: BCG.
IMO (International Maritime Organization) (2023) Revised MARPOL Annex VI — CII Rating Methodology, Reduction Factors 2023–2030, and EU ETS Integration Framework. London: IMO.
Lloyd's List Intelligence (2026a) Shipping Intelligence Podcast: "Decarbonisation is a significant factor in commercial decision-making."Speaker: Sean Riley, Veson Nautical. April 2026. London: Lloyd's List.
Lloyd's List Intelligence (2026b) Shipping Intelligence Podcast: "Emissions compliance data can deliver efficiency and competitive advantage." Speaker: 90POE. March 2026. London: Lloyd's List.
Poseidon Principles (2024) Annual Report: Portfolio Alignment and Financed Emissions 2024. New York: Poseidon Principles Secretariat.
PwC (2026) Sustainable Shipping Economics: Green Finance Eligibility, EBITDA Impact Modelling, and Asset Valuation Effects of CII Rating. London: PricewaterhouseCoopers.
Sea Cargo Charter (2025) Annual Transparency Report 2025: Emissions Performance, Charter Rate Differentials, and Fixture Market Data. Geneva: Sea Cargo Charter Secretariat.
© René Grywnow, DBA · Strategic Intelligence Brief · April 2026 Efficiency Before Fuel Series · Week 16, Part I
Note: This article reflects my personal views based on industry experience and publicly available information. It does not constitute professional, legal, or investment advice and does not represent the views of my employer.